Online Shiny appliations
Discrete logistic growth map
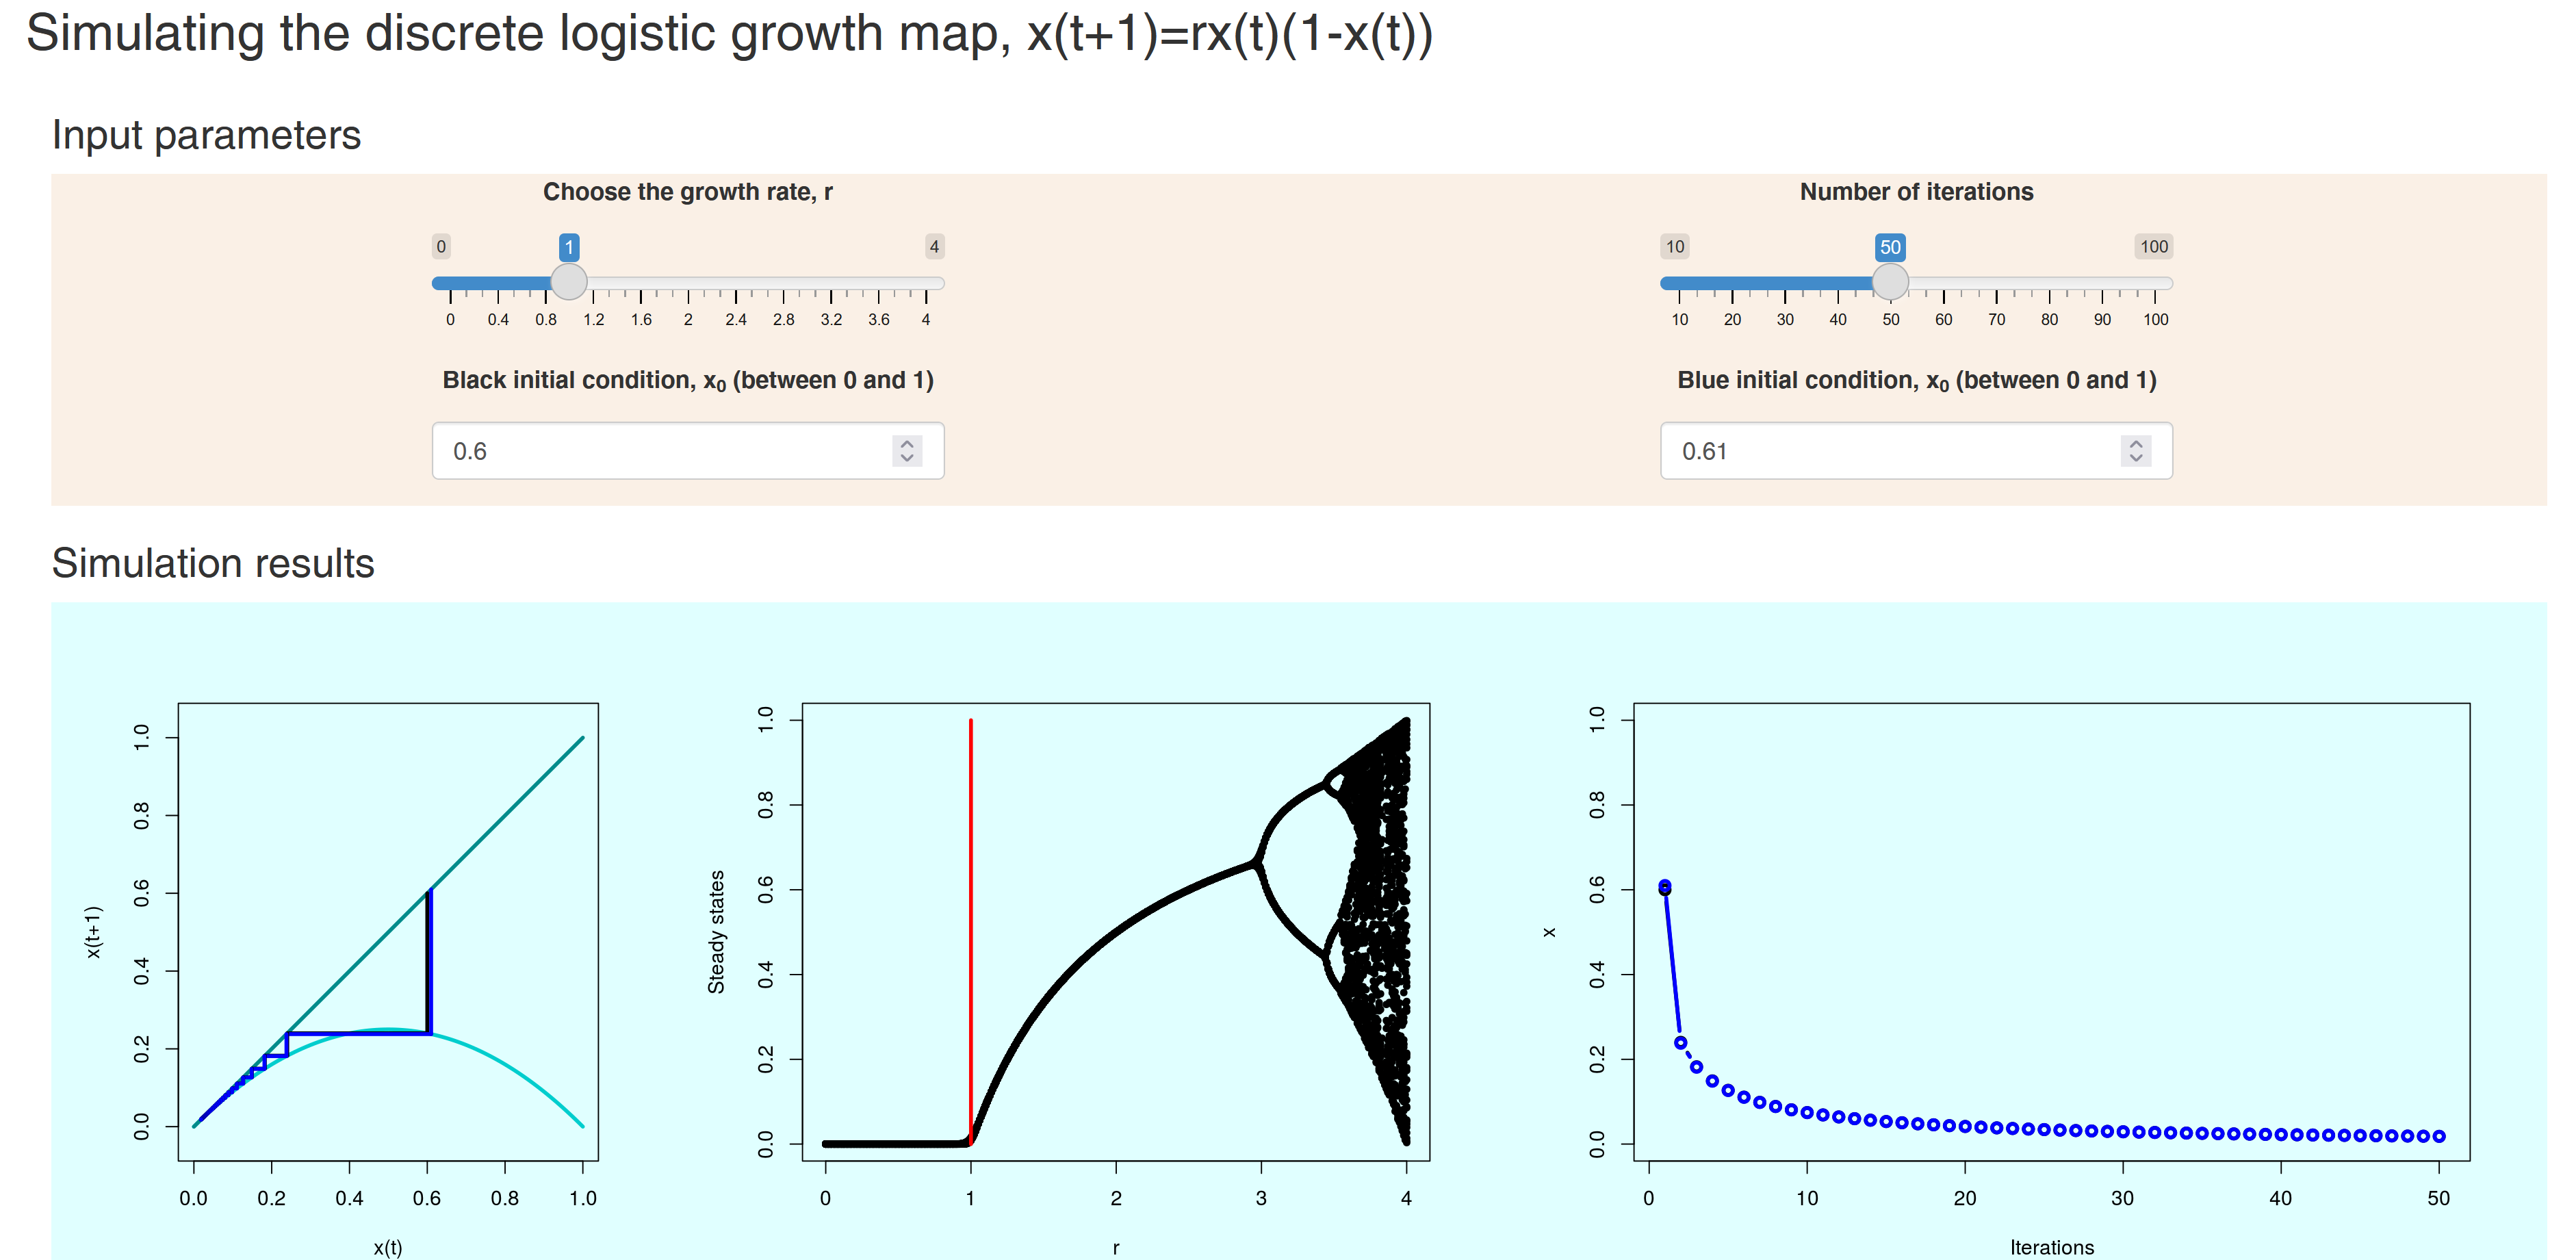
- There are many simulators of the Logistic map out there. Some consider the fractal bifurcation structure,
some teach you how to do cobwebbing. But I have found none that considers the interaction of all these features and more.
So, I coded my own. This shiny app allows you to simulate two trajectories at the same time (right plot), so you can see how chaos grows.
Moreover, you can compare the these with the cobweb plots (left plot) as they are on the same y-axes.
Equally, you can understand the dynamics that you are seeing from reading the bifurcation plot in the middle.
Covid-19: infection predictor
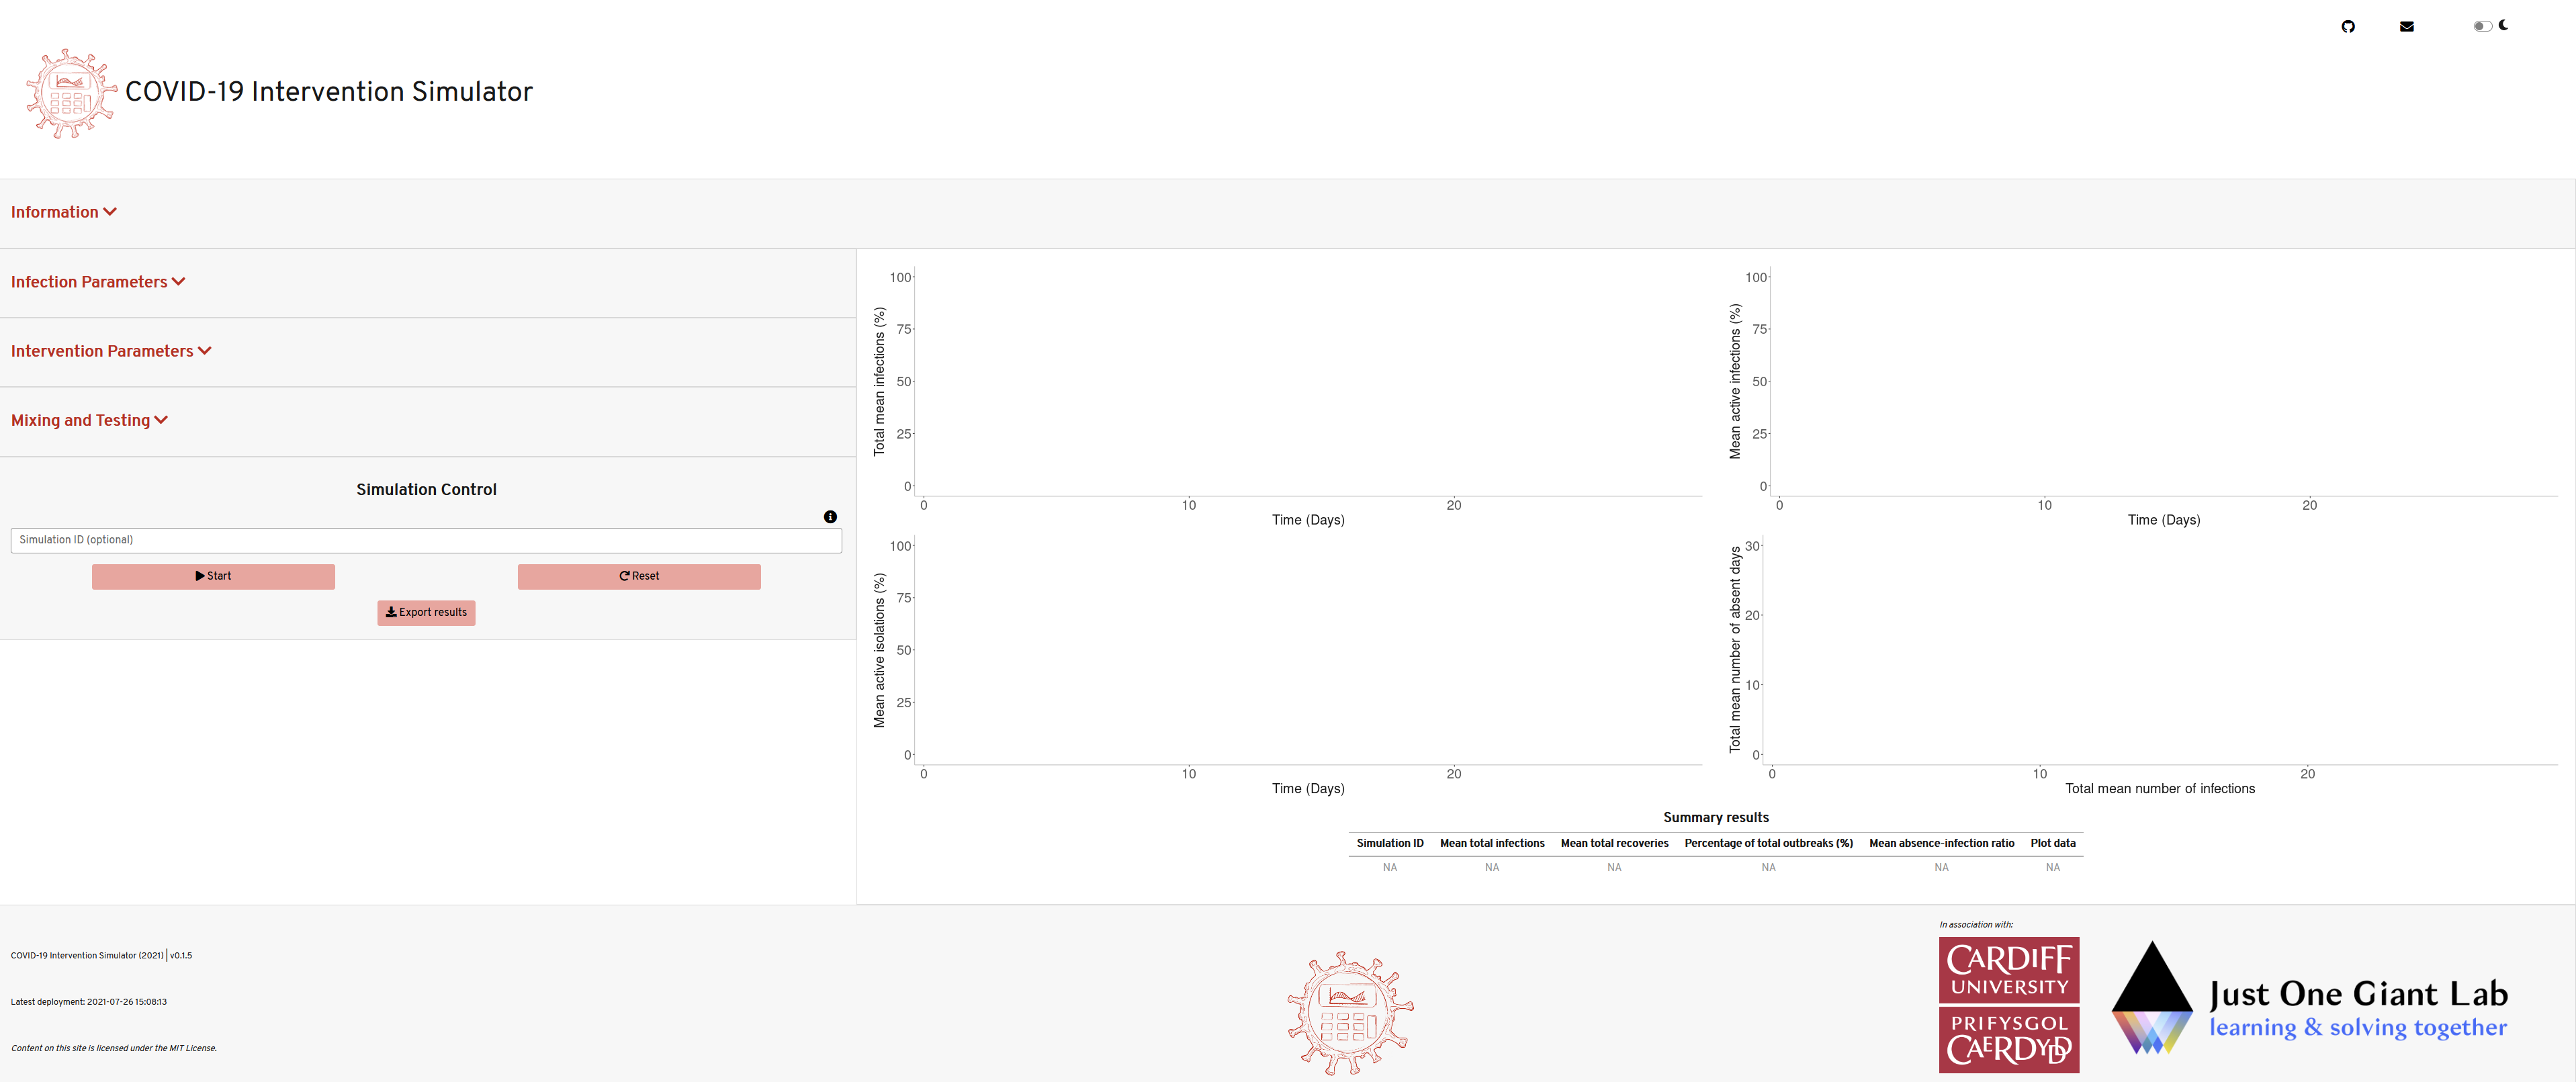
- Prediciting the spread of Covid-19 in educational settings has a
number of complications, least of all because children are frequently asymptomatic.
The Welsh Government wanted to know how effective different interventions were in these
scenarios. We (Josh Moore and I) won a microgrant from JOGL
that allowed us to turn our research
into an online calculator that put the predictive power back into the hands of the policy
maker. Namely, by reading the instructions and watching the tutorial videos in the "Information" panel,
you will learn how to run your own individual-based simulation that can be compared to other
simulations with different interventions.
Covid-19: Public transport seating optimiser
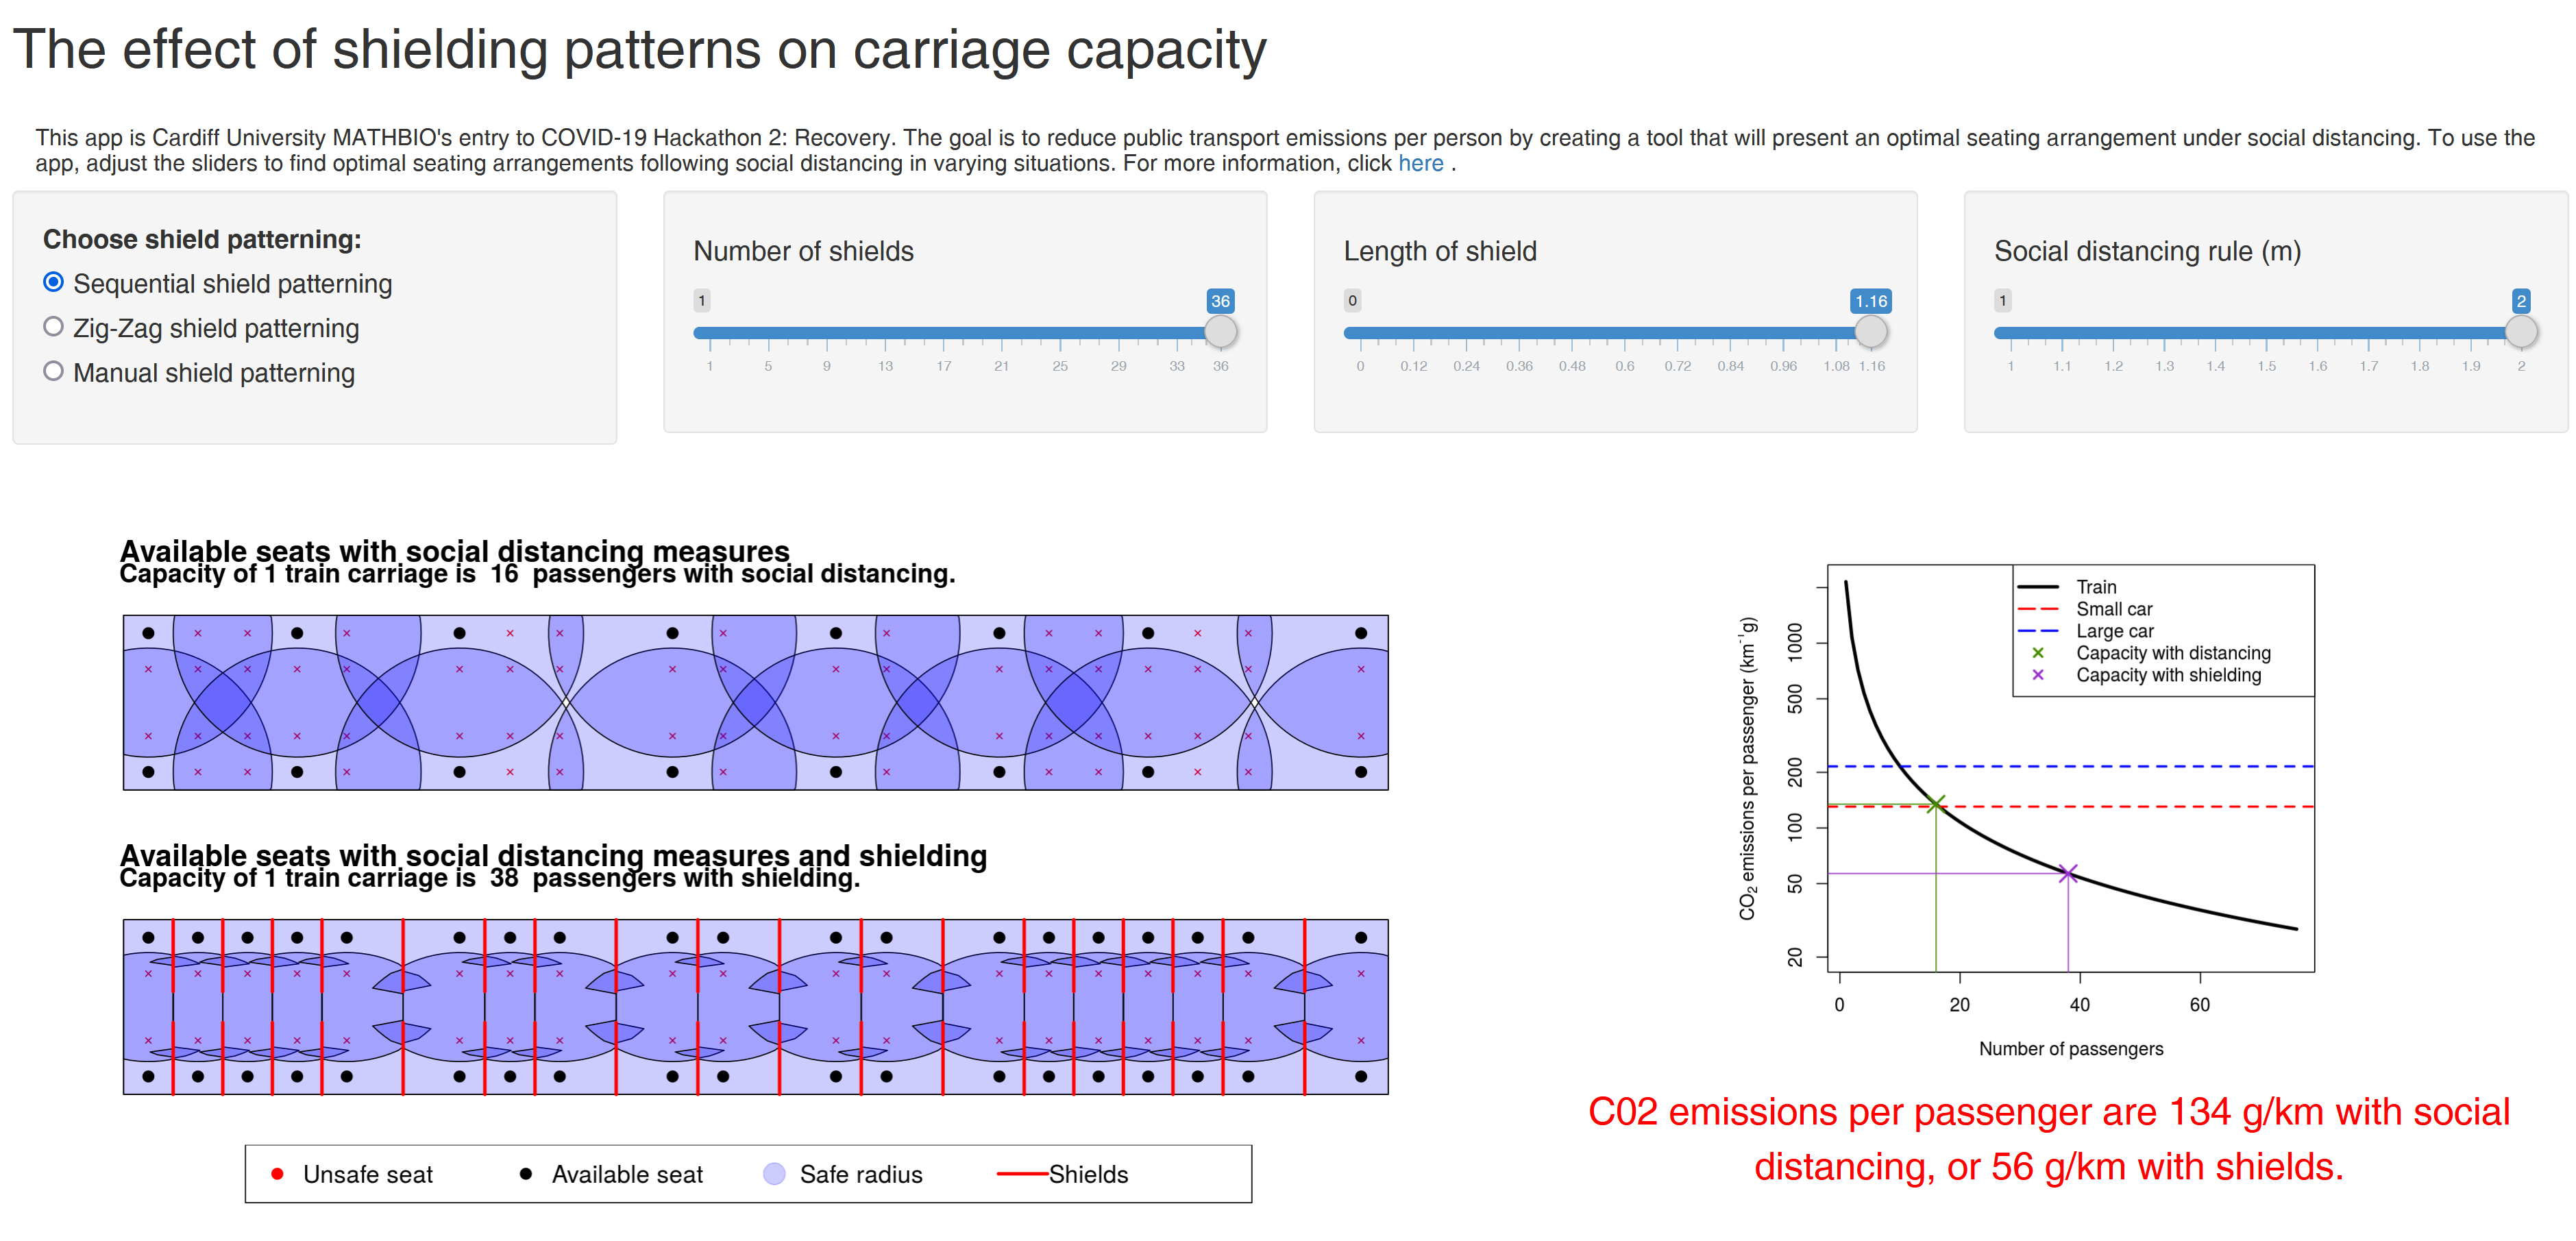
- The doctoral students Lucy Henley, Josh Moore
and Tim Ostler competed in the NERC 2020 Hackathon
to create a digital solution to help the environment during the pandemic.
They won the compeition by focusing on optimising the seating on public transport.
Using a greedy algorithm, they fit circles, which are the people plus
their social distancing bubble. Critically, the app shows
that you can not fit enough people on a diesel train to make it more
environmentally friendly than a small family car. Particularly if the car
is full. This work was submitted as written evidence for the Parliament
committee investigating environmental impacts of Covid-19, "LBC0048 - Life beyond COVID".
Covid-19: Student generated cases
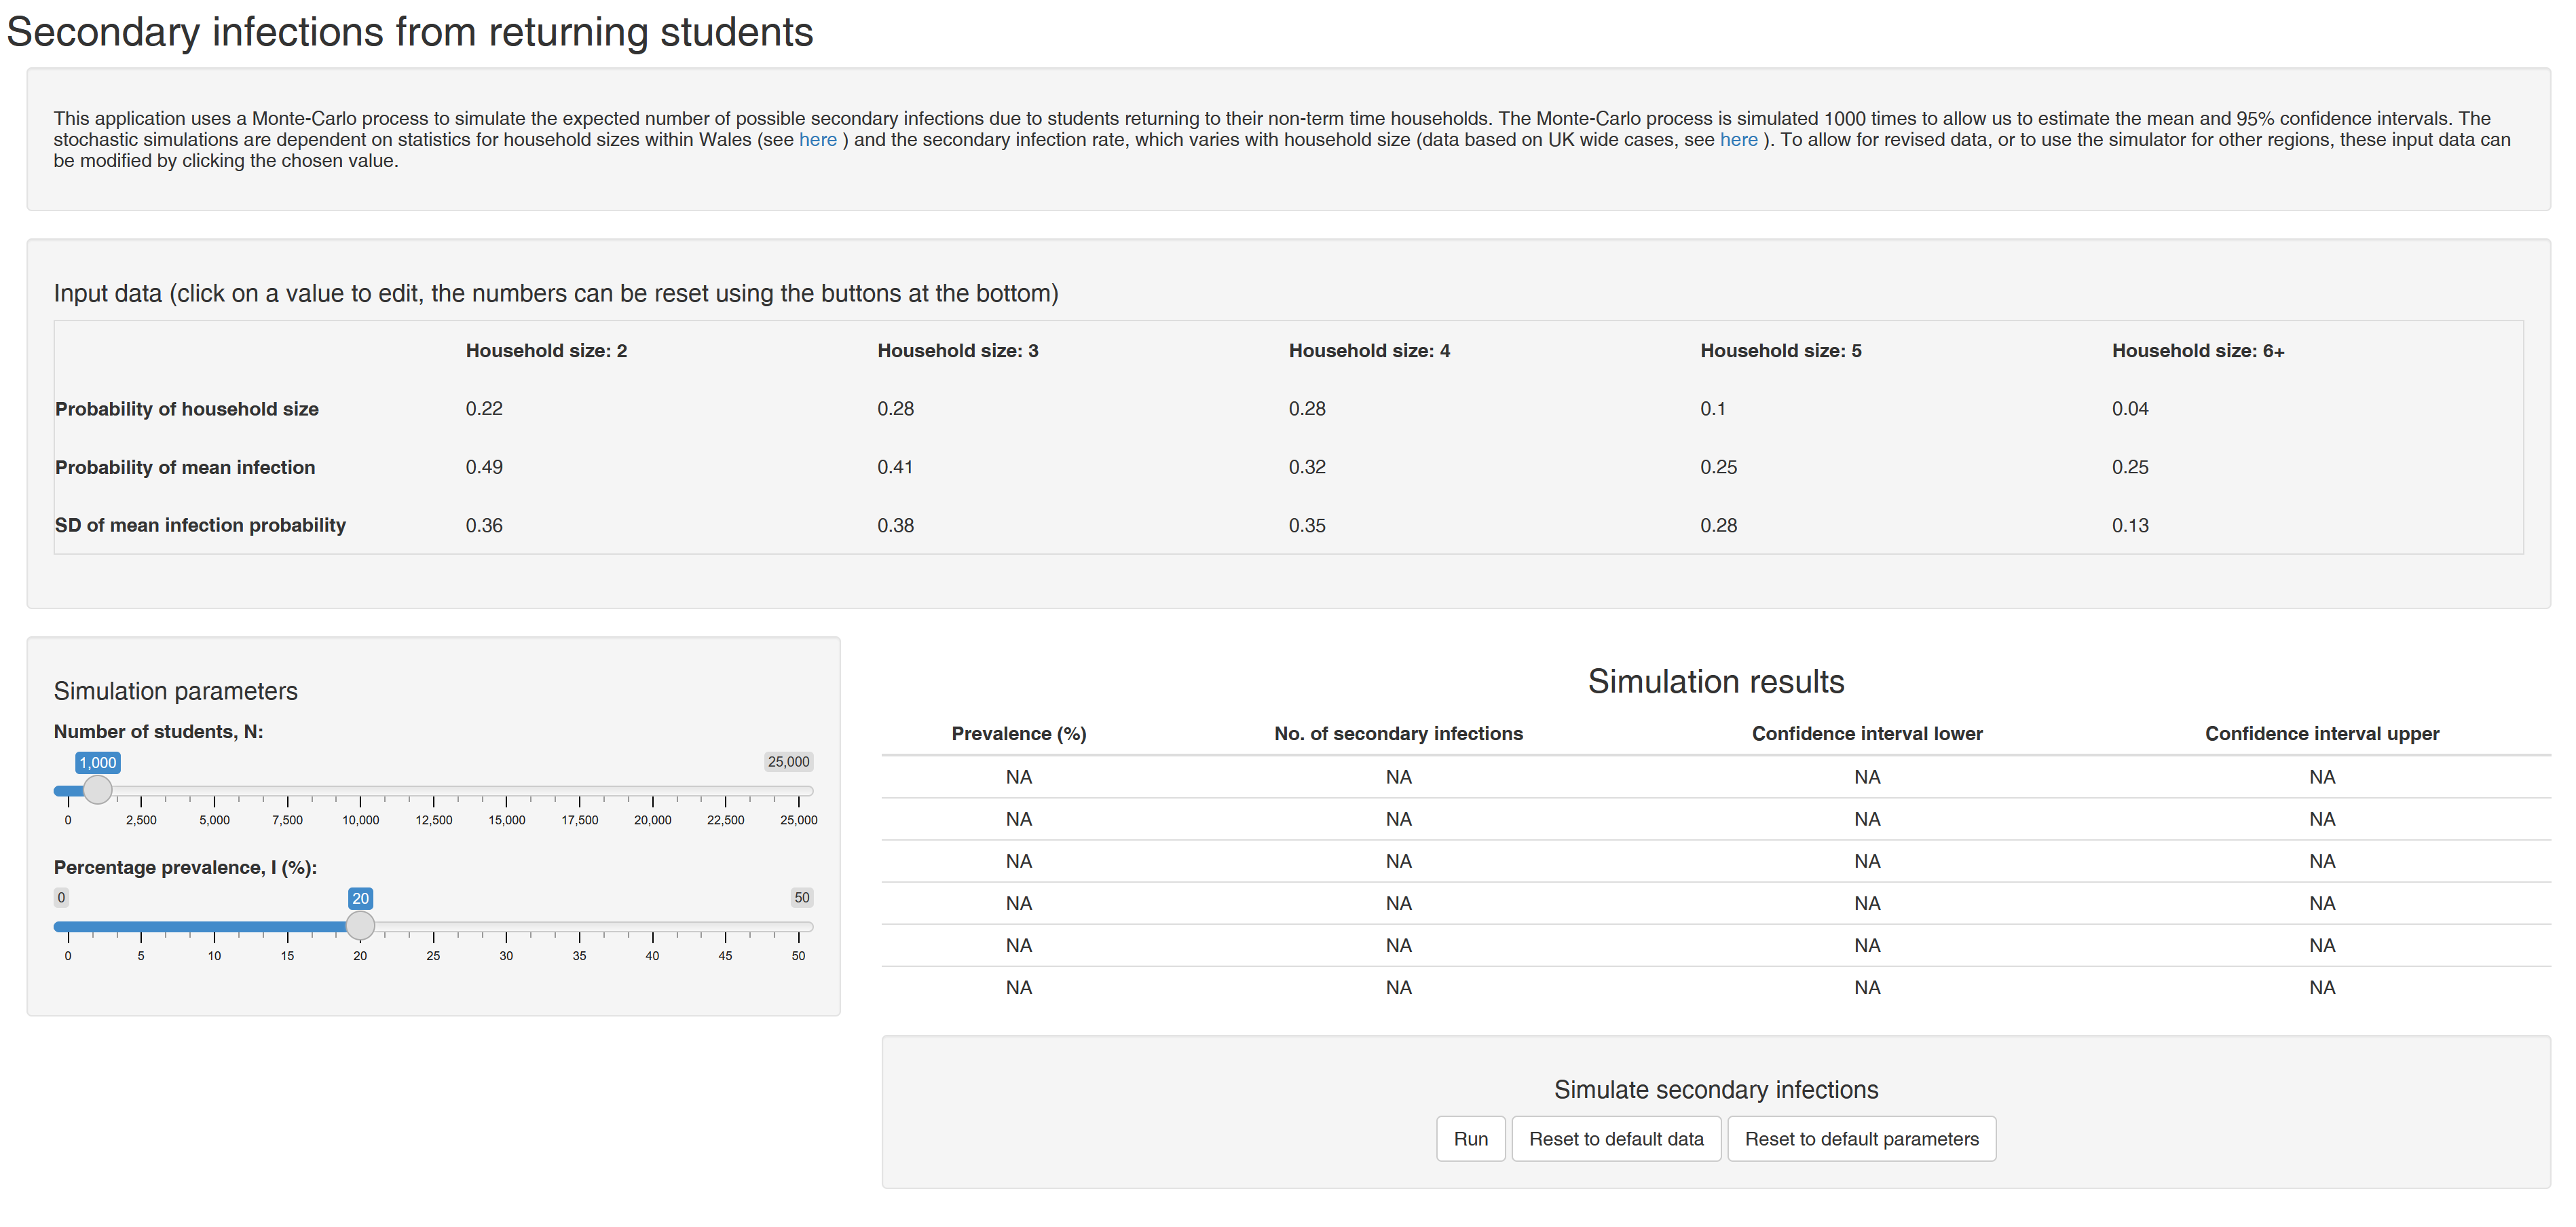
- We (Prof. Paul Harper, Josh Moore and I) were tasked by Welsh Government to estimate how many secondary Covid-19 cases
students returning home would generate, over the Christmas holidays. Our research concluded
that at the time the cases were roughly 1-to-1. Namely, each infected students sent home would
generate one further case. However, this depends on a number of factors, such as transmissibility.
This applet allows a user to input the transmissibility data and generate their own information
regarding the number of secondary cases.